Initial Idea
How might I …
Create code based interactive media about data around gender and sexuality stereotyping, used by people who think technology is neutral.
How might I …
Create code based interactive media about data around gender and sexuality stereotyping, used by people who think technology is neutral.
Gender / Sexuality Assumption
Paper prototype designed to see how people react to the stereotypical assumption based on thier gender and sexuality.
How Gay are You Quiz
This is a prototype designed to see how people react to already existing internet quizs that test how gay people are. These do not have any scientific reasoning to determin how gay people are. Classmates took these tests and reported to me about thier insight toward these type of tests.
IBM’s Personality Insight Demo
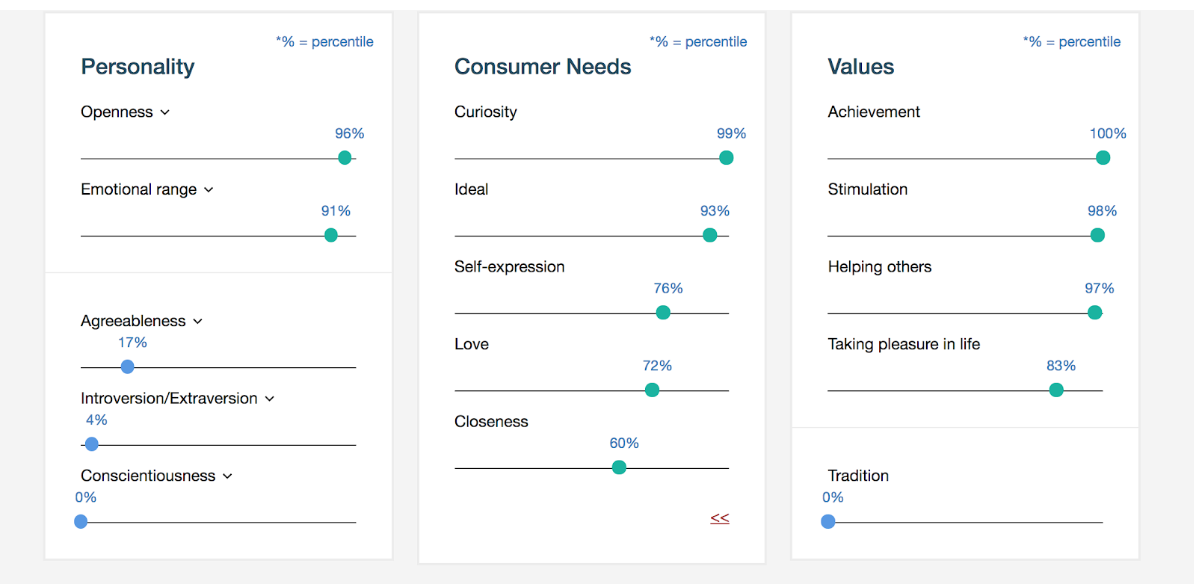
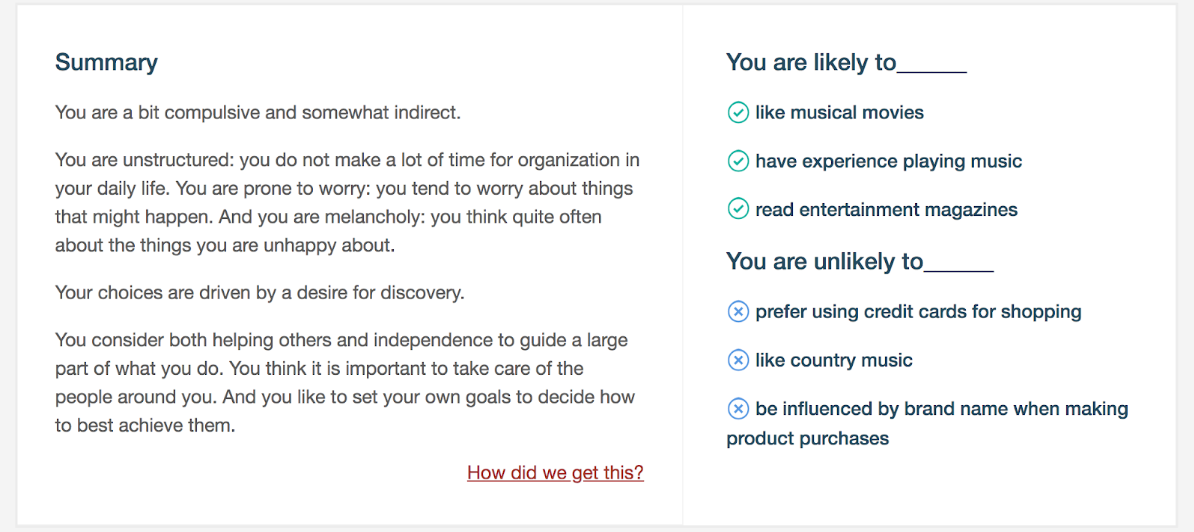
I wanted to test out people’s reaction to linguistic profile of their writing structure since this could be used on their story. So I asked them to type in any story or opinion related to sexuality in the IBM’s Personality Insight Demo page.
google form
Created google form to explore the way to collect data and story. Sent to 5 people (I took it myself too). I decided to see how having the labels of nationality, ethnicity, gender, and sexuality would change the way people see the story, see the people they know. I think it affected me the most because the format of the form let people to take time to answer and the story was very personal. I did not know what they were going through, what they were thinking, even though they are very close to me.
back end test
Developed back end of the Personality-Insight-API to send JSON file with people’s story which was toledo in previous prototype to the IBM cloud’s personality insight, get JSON file of personality portrait back, go through the result JSON file to find out which big 5 personality they belong to, go through trait and move only high scored trait into array, go through array to match the style of string the broken library reference JSON, find the high definition of the trait, store those information into the JSON file.
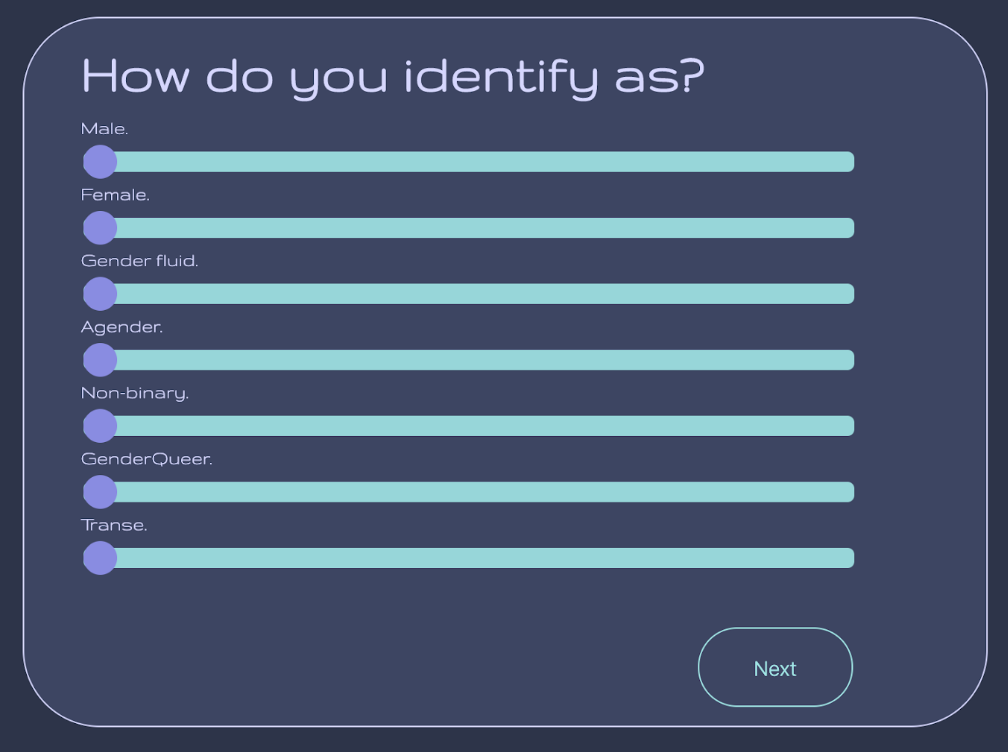
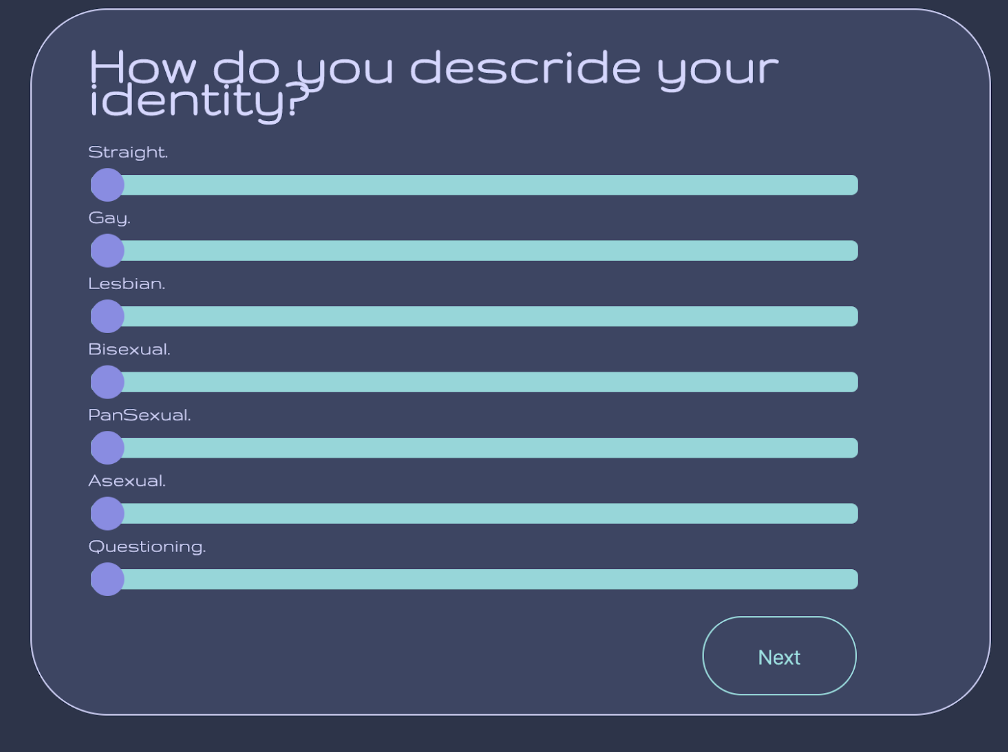
creating the new type of form
Website mock-up from scratch including the visualization, form, and process I have been taking. New forms that challenges users to really think about their identity. Instead of having multiple choices for gender and sexuality, I decided to incorporate multiple slider where user can place the dot to where they feel comfortable. Also asked to pick two topics to answer in short answer format. I also made some visualization using answers of older form. One that has people's labels next to their personal story, another that sorts the participating people to big 5 personality.
Whole documentation for the thesis one is in this documentation
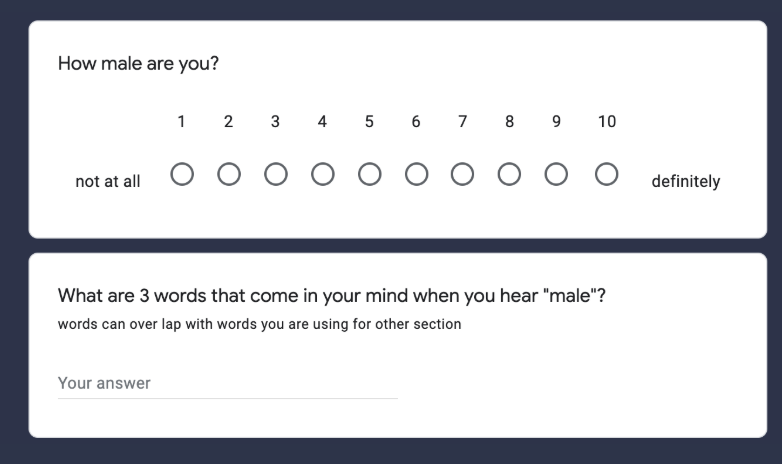
creating Google form
Concidering the time frame and usability of data collected, creating a google form survey that can be embed to the website here. Questions including asking people to give a key word to each teminology that are used to see how people see the LGBT related vocabulary.
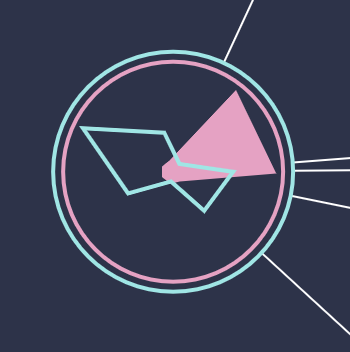
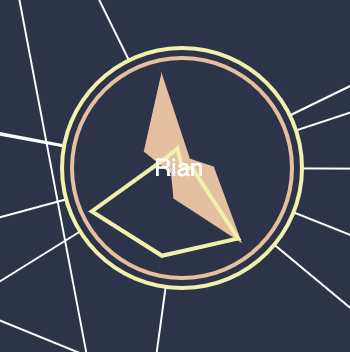
Connection Visualization
Two circle used to show how people chooes a lable of their gender and sexuality when they need to pick one and line graph are used to show how people represent themselve in spectrum of that terminology. Line between people shows the connection they have to each other such as "high school", "college"
the challenge here was making the chart
using begine shape and end shape from p5, it restrict the transform method. So I needed to calculate each point using trigonometry
I also struggled to not color codinate the teminology by color. To do that I runded randamaization to make set the color.
another challenge was not to overlap all person. I am not really sucsessful here yet. As more people perticipate in form, there is more chance of overlapping
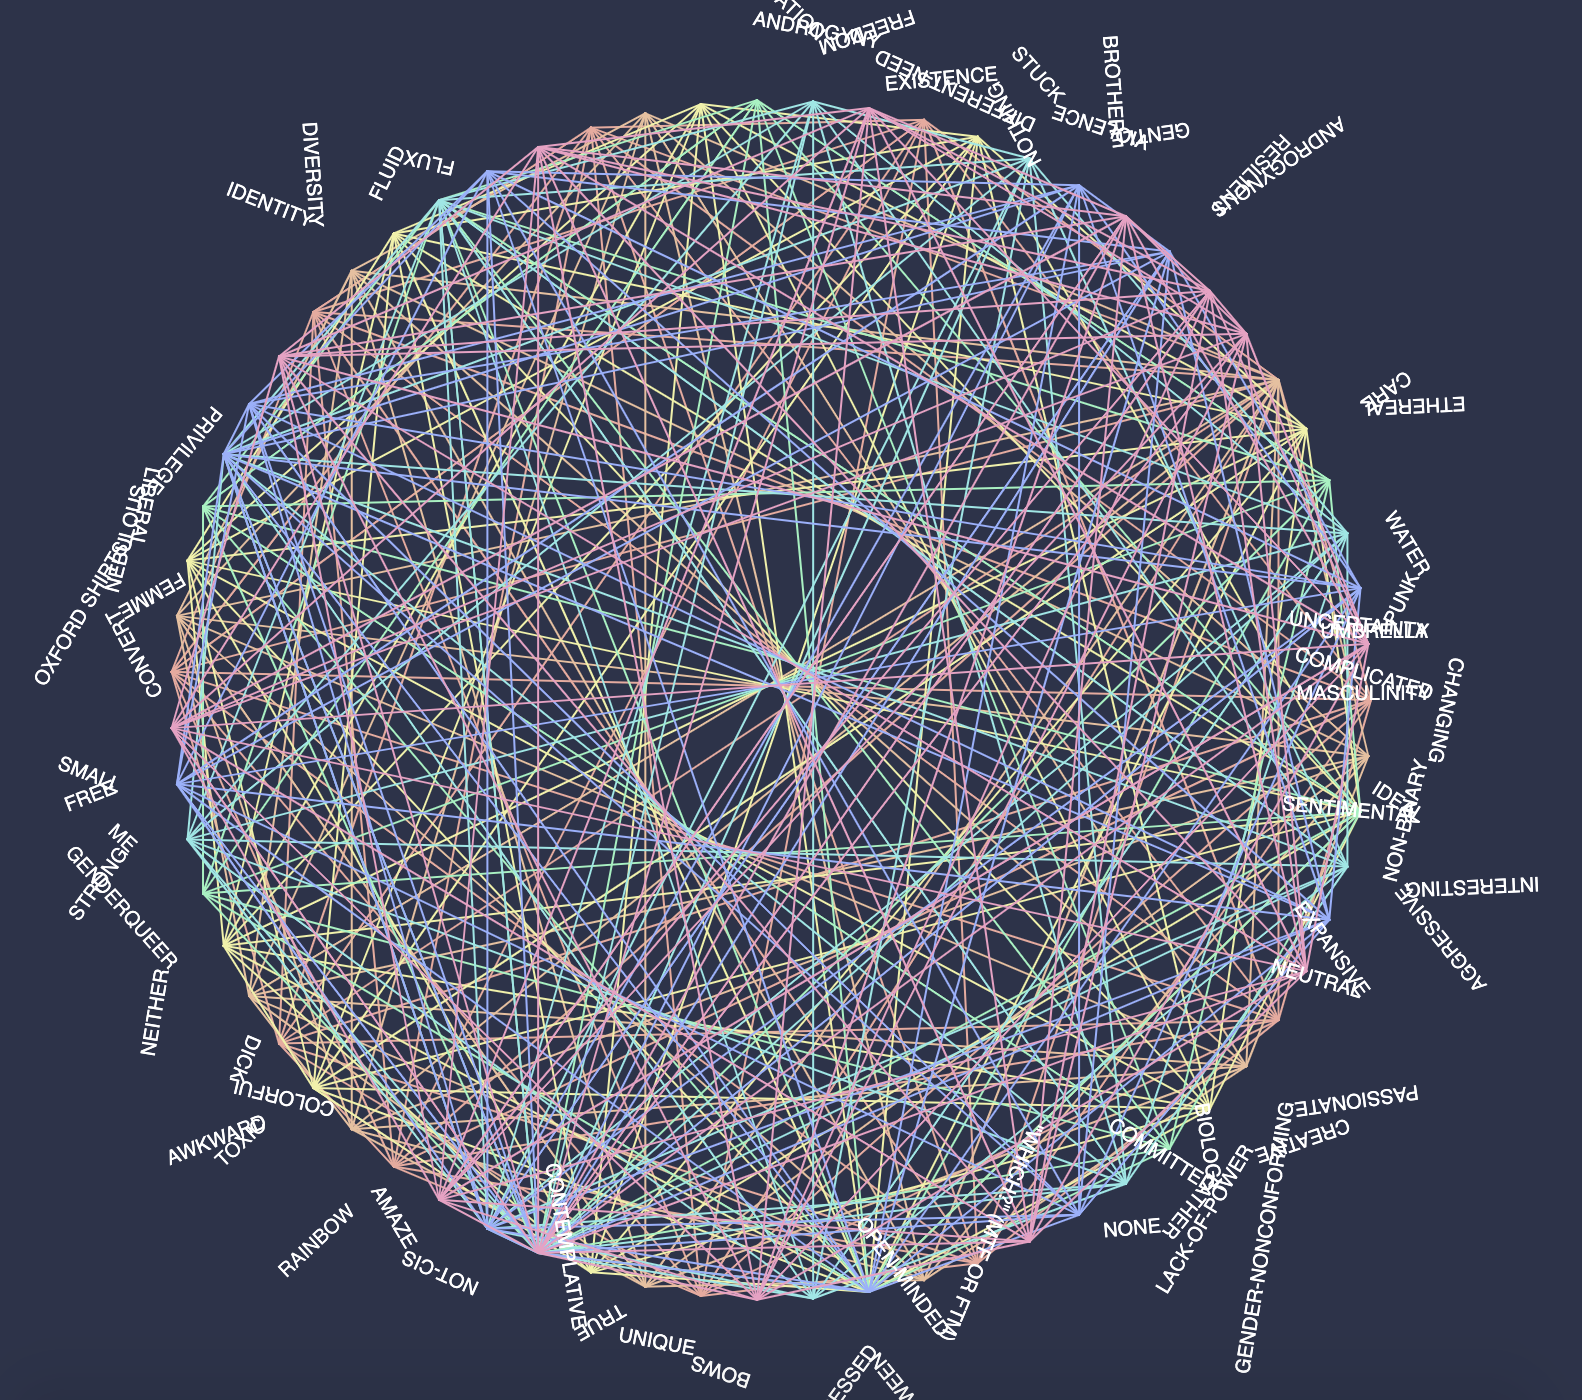
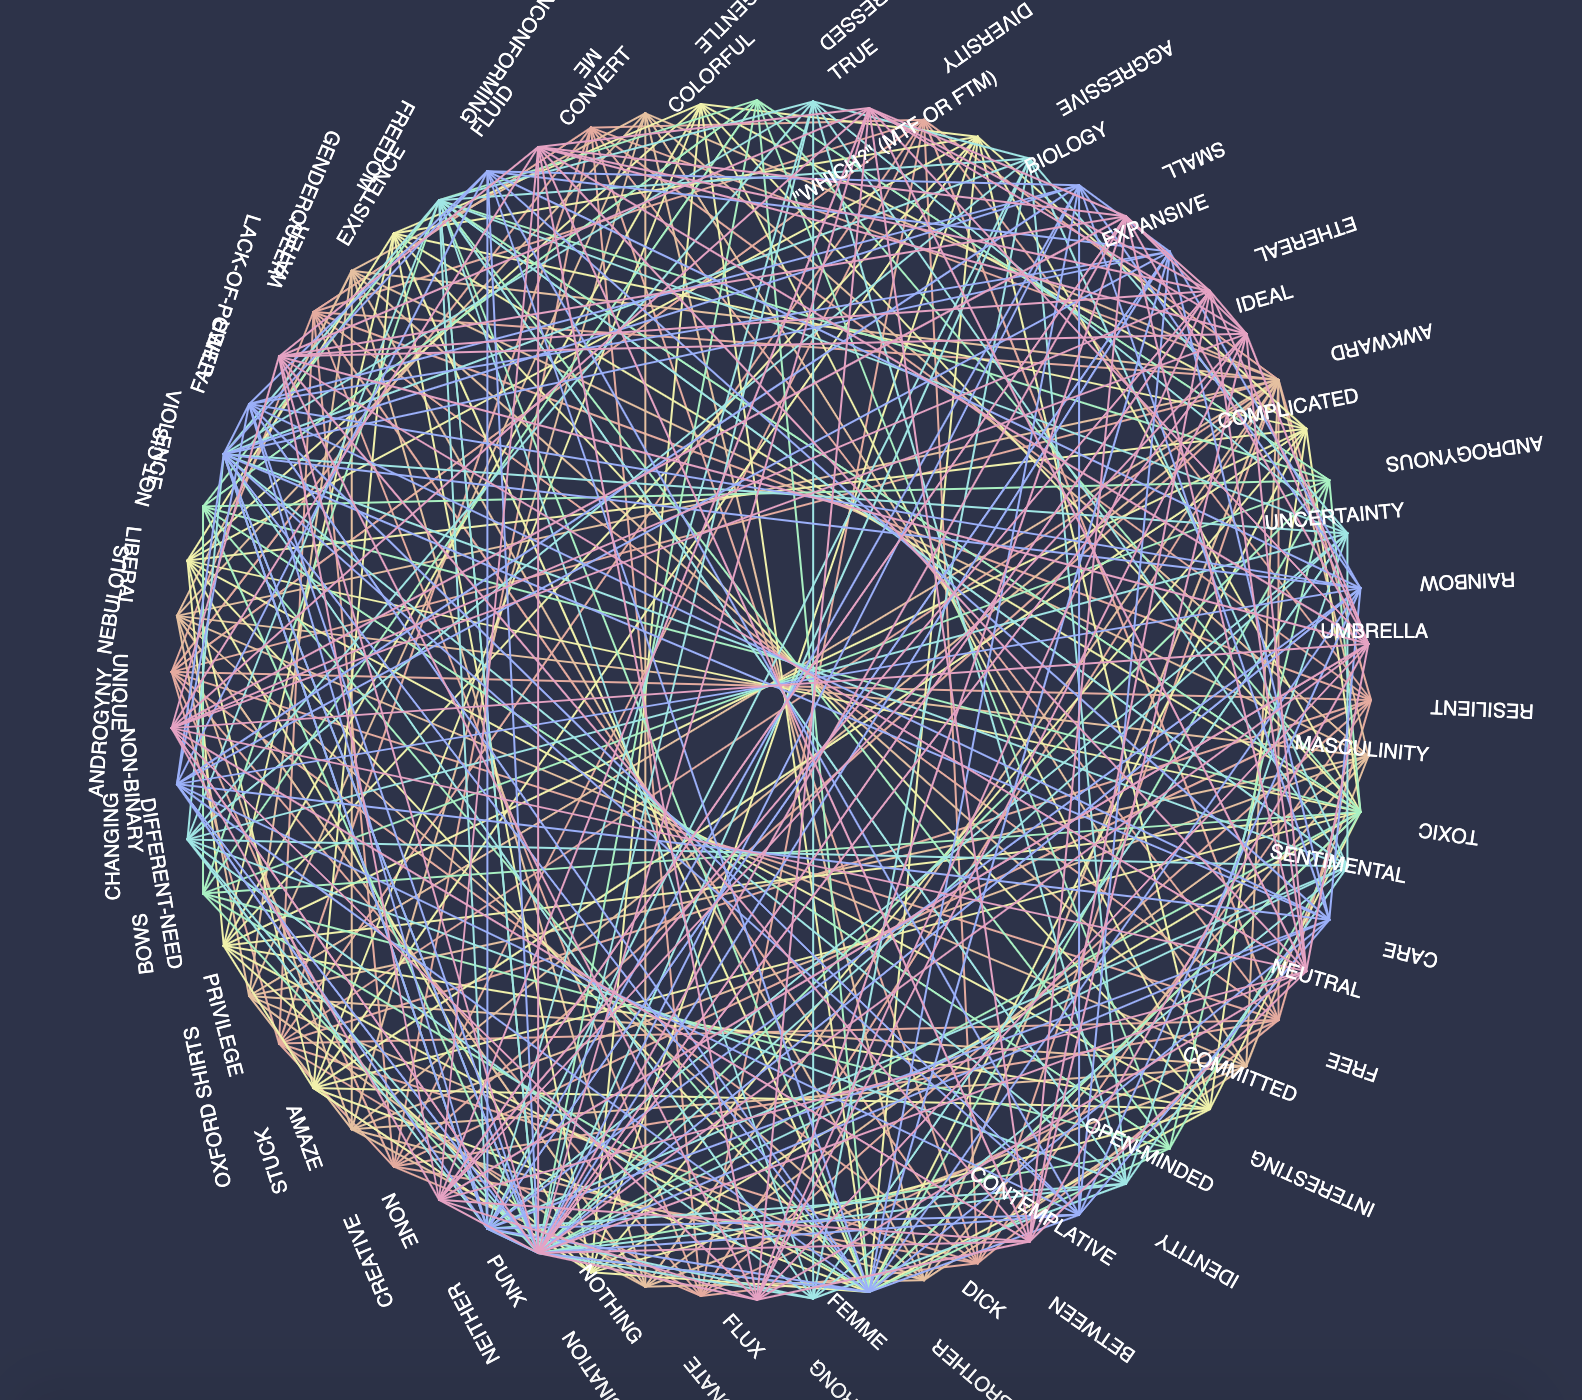
Terminology Visualization
Using words people who I sent survey used to describe specific teminology about gender or sexuality, I have created a circuler visualization to show the connection between words. Some teminology has more words to describe but some others are made with less words.
some fun pic of trying to make everything lined up
Virtual Thesis Show
for the virtual Thesis show, I have decided to have two working prototype online and other parts to keep proceding before being available to poeple online. It was supporce to have intteraction fot the Gender term Visualization and the Sexual term visualization, and also page of every person who I have asked to take form I have created. It will contain story they have shared with me and short paragraph about who are they to me as well as letter to each one of them. Because this project is being done in the time of world pandemic, the way I see the world, way I see my friends, how I feel about them has change. Very much. This was suppose to be done before I leave USA as a part of closure to chapter of my life. Since I have been back I am n process of re-reading each one of the story they have shared with me and re-writing the paragraph as well as letter to them. It will soon be up as I finish revisiting them.
future plan
My plan for this website from now on is to add interaction into the visualizations to improve the message of the visulization. Also my hope is that I will meet some poeple here in Japan who will truly influence the way I seek the world and improve this website as my perspective of the world changes and widen.